
Automating Blog Analytics with Google Analytics MCP and AI Agents
Learn how to automate blog analytics and make data-driven decisions using MCP and AI agents
Automating Blog Analytics with Google Analytics MCP and AI Agents
When running a blog, the most crucial question is: “How well is my content performing?” While Google Analytics is a powerful tool, manually logging into dashboards to check and analyze data can be tedious. This guide shows you how to completely automate blog analytics using Model Context Protocol (MCP) and AI agents.
This guide provides step-by-step instructions for an analytics automation system applied to a live blog, complete with ready-to-use code and query examples.
Why Automate Blog Analytics?
Limitations of Traditional Approaches
Google Analytics dashboards provide tons of data, but extracting actionable insights requires multiple steps:
- Manual Data Collection: Logging into dashboards and finding the metrics you need
- Complex Query Writing: Understanding GA’s complex interface to create custom reports
- Repetitive Tasks: Repeating the same process for weekly/monthly reports
- Lack of Insights: You see numbers, but not answers to “what should I do next?”
The MCP and AI Agent Solution
Model Context Protocol (MCP) is a standard protocol that enables AI to communicate with external data sources. Using Google Analytics MCP:
- Natural Language Queries: Ask “What were the most popular posts last week?” and get instant answers
- Automated Analysis: AI agents regularly analyze data and generate reports
- Actionable Insights: Not just numbers, but recommendations on “what to write next”
What is Google Analytics MCP?
How MCP Works
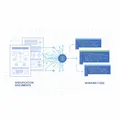
MCP is a standardized communication protocol between AI models and data sources. Think of it like an API, but designed for AI to understand and utilize directly.
┌─────────────┐      MCP Protocol      ┌──────────────────┐
│             │ ◄──────────────────── ► │                  │
│  AI Agent   │                         │  Google Analytics│
│  (Claude)   │                         │      MCP         │
│             │                         │                  │
└─────────────┘                         └──────────────────┘
Google Analytics MCP Features
Google Analytics MCP provides:
- Report Queries: Access various metrics and dimensions via GA4 Data API
- Real-time Data: Live visitor counts and event tracking
- Custom Queries: Request complex filters and segments in natural language
- Automatic Analysis: AI performs trend analysis, comparisons, etc.
Installation and Setup
1. Installing Google Analytics MCP
First, install the Google Analytics MCP server. This is a standalone server you can run via npx.
# No separate installation needed for MCP server
# Just add it to Claude Desktop or Claude Code configuration file
2. Google Cloud Project Setup
To use the Google Analytics API, you need a Google Cloud project:
Step-by-step setup:
- Go to Google Cloud Console
- Create a new project or select an existing one
- Enable Google Analytics Data API
- Create service account and download key
# Automated setup using Google Cloud CLI
gcloud services enable analyticsdata.googleapis.com

# Create service account
gcloud iam service-accounts create ga-mcp-reader \
  --display-name="Google Analytics MCP Reader"

# Generate key file (save to credentials folder)
gcloud iam service-accounts keys create ~/credentials/ga-credentials.json \
--iam-account=ga-mcp-reader@PROJECT_ID.iam.gserviceaccount.comImportant: Replace PROJECT_ID with your actual Google Cloud project ID.
3. Google Analytics Permissions
Grant the service account read access to your GA4 property:
- GA4 Property → Admin → Property Access Management
- Click ”+” button in top right
- Enter service account email address (e.g.,
ga-mcp-reader@PROJECT_ID.iam.gserviceaccount.com) - Role: Select Viewer
- Click Add
Security Tip: Grant read-only permissions to prevent data modification.
4. Claude Code MCP Configuration
Create or modify the .mcp.json file in your project root:
{
  "mcpServers": {
    "analytics-mcp": {
      "command": "npx",
      "args": ["-y", "@upenn-libraries/google-analytics-mcp"],
      "env": {
        "GOOGLE_APPLICATION_CREDENTIALS": "/path/to/your/ga-credentials.json"
      }
    }
  }
}Important: Update the GOOGLE_APPLICATION_CREDENTIALS path to your actual service account key file location.
Security Note:
# Must add credentials folder to .gitignore
echo "credentials/" >> .gitignore
echo "*.json" >> .gitignore
5. Verify Setup
Restart Claude Code and verify MCP connection:
# Test with this command in Claude Code
"Show me my Google Analytics account information"
If successful, you’ll see property ID, property name, etc.
8 Ready-to-Run Queries
Once setup is complete, you can immediately run these queries. These provide essential insights for actual blog operation.
1. Real-time Activity Check
See what’s happening on your blog right now:
mcp__analytics -
  mcp__run_realtime_report({
    property_id: 395101361, // Replace with your property ID
    dimensions: ["unifiedScreenName", "country"],
    metrics: ["activeUsers"],
  });
What you’ll learn:
- Current number of active users
- Which pages they’re viewing
- Which countries they’re from
2. Last 7 Days Summary
Understand weekly traffic trends:
mcp__analytics -
  mcp__run_report({
    property_id: 395101361,
    date_ranges: [{ start_date: "7daysAgo", end_date: "today" }],
    dimensions: ["date"],
    metrics: [
      "activeUsers",
      "sessions",
      "screenPageViews",
      "averageSessionDuration",
    ],
    order_bys: [
      { dimension: { dimension_name: "date", order_type: 1 }, desc: true },
    ],
  });
How to use:
- Track daily traffic changes
- Analyze day-of-week patterns (weekend vs weekday)
- Calculate week-over-week growth rate
3. Top 10 Content (Last 30 Days)
See which posts got the most readers:
mcp__analytics -
  mcp__run_report({
    property_id: 395101361,
    date_ranges: [{ start_date: "30daysAgo", end_date: "today" }],
    dimensions: ["pagePath", "pageTitle"],
    metrics: ["screenPageViews", "activeUsers", "userEngagementDuration"],
    dimension_filter: {
      filter: {
        field_name: "pagePath",
        string_filter: {
          match_type: 2, // CONTAINS
          value: "/blog/",
          case_sensitive: false,
        },
      },
    },
    order_bys: [{ metric: { metric_name: "screenPageViews" }, desc: true }],
    limit: 10,
  });
Insights:
- Analyze Top 10 posts → Expand similar topics
- Posts with high engagement time → Quality benchmarks
- Lower-ranked posts → Need SEO optimization
4. Traffic Source Analysis
Understand where visitors come from:
mcp__analytics -
  mcp__run_report({
    property_id: 395101361,
    date_ranges: [{ start_date: "30daysAgo", end_date: "today" }],
    dimensions: ["sessionDefaultChannelGroup", "sessionSource"],
    metrics: ["sessions", "activeUsers", "bounceRate"],
    order_bys: [{ metric: { metric_name: "sessions" }, desc: true }],
    limit: 20,
  });
Strategy development:
- Organic Search percentage → Measure SEO effectiveness
- Social traffic → Which platforms are effective
- Direct traffic → Brand awareness indicator
- Referral → Backlink effectiveness
5. Geographic Distribution
Check global reach:
mcp__analytics -
  mcp__run_report({
    property_id: 395101361,
    date_ranges: [{ start_date: "30daysAgo", end_date: "today" }],
    dimensions: ["country", "city"],
    metrics: ["activeUsers", "sessions"],
    order_bys: [{ metric: { metric_name: "activeUsers" }, desc: true }],
    limit: 20,
  });
Multilingual blog strategy:
- Korean content → Check Korean reader ratio
- English content → Analyze US, India, European readers
- Japanese content → Measure Japanese reader response
6. Device & Browser Breakdown
Understand user environment:
mcp__analytics -
  mcp__run_report({
    property_id: 395101361,
    date_ranges: [{ start_date: "30daysAgo", end_date: "today" }],
    dimensions: ["deviceCategory", "browser"],
    metrics: ["sessions", "bounceRate", "averageSessionDuration"],
    order_bys: [{ metric: { metric_name: "sessions" }, desc: true }],
  });
UX optimization:
- Mobile ratio 50%+ → Prioritize mobile optimization
- High bounce rate on specific browser → Check compatibility issues
- Long desktop session time → Strengthen deep content
7. New vs Returning Visitors
Check if building loyal readership:
mcp__analytics -
  mcp__run_report({
    property_id: 395101361,
    date_ranges: [{ start_date: "30daysAgo", end_date: "today" }],
    dimensions: ["newVsReturning"],
    metrics: [
      "activeUsers",
      "sessions",
      "screenPageViews",
      "averageSessionDuration",
    ],
  });
Goal setting:
- New visitor ratio 60-70% → Growing
- Returning visitor ratio 30-40% → Good loyalty
- High pages per session for returning visitors → Active content exploration
8. Landing Page Analysis
Optimize entry points:
mcp__analytics -
  mcp__run_report({
    property_id: 395101361,
    date_ranges: [{ start_date: "30daysAgo", end_date: "today" }],
    dimensions: ["landingPage"],
    metrics: ["sessions", "bounceRate", "averageSessionDuration"],
    order_bys: [{ metric: { metric_name: "sessions" }, desc: true }],
    limit: 15,
  });
SEO insights:
- High search traffic landing pages → Keyword analysis
- High bounce rate landing pages → Suspect content-title mismatch
- Long session time landing pages → Add internal links to related posts
Tip: Change the property_id in each query to your GA4 property ID. You can find it in the GA4 Admin page.
Building AI Agent-Based Analytics System
Designing the Analytics Agent
Let’s create a specialized AI agent for blog analytics. Create the file .claude/agents/analytics.md:
# Analytics Agent

You are a data analyst specialized in blog analytics.

## Your Role

Analyze Google Analytics data for the blog and provide:

- Traffic trends and patterns
- Content performance insights
- Audience behavior analysis
- Actionable recommendations

## Key Metrics to Track

1. **Traffic Metrics**

   - Total users, sessions, pageviews
   - New vs returning users
   - Traffic sources (organic, direct, referral, social)

2. **Content Performance**

   - Top performing posts (by pageviews, engagement)
   - Average time on page
   - Bounce rate by content type

3. **Audience Insights**
   - Geographic distribution
   - Device breakdown (mobile, desktop, tablet)
   - User journey and navigation paths

## Analysis Framework

When analyzing data:

1. Identify trends (week-over-week, month-over-month)
2. Find anomalies or interesting patterns
3. Compare against benchmarks or goals
4. Provide specific, actionable recommendations

## Report Format

Always structure reports as:

- **Executive Summary**: Key findings in 2-3 sentences
- **Metrics Overview**: Numbers with context
- **Insights**: What the data tells us
- **Action Items**: What to do next
Automated Report Generation
Now you can use this agent to generate automatic reports. For example:
Question: “Analyze blog traffic for the past 7 days and provide insights”
AI Response Example:
## Weekly Traffic Analysis Report (Oct 28 - Nov 3, 2025)

### Executive Summary
Last week saw 1,234 total visitors, a 23% increase from the previous week.
The "Google Analytics MCP" post surged, driving organic traffic growth.

### Metrics Overview
- **Total Users**: 1,234 (↑23% vs previous week)
- **Sessions**: 1,567 (↑18%)
- **Pageviews**: 3,456 (↑31%)
- **Avg Session Duration**: 2m 34s (↑12%)
- **Bounce Rate**: 45% (↓5pp)

### Top Traffic Sources
1. Organic Search: 58% (mainly Google)
2. Direct: 25%
3. Social: 12% (Twitter leading)
4. Referral: 5%

### Top Performing Posts
1. "Google Analytics MCP Guide" - 456 views (new post)
2. "Building an Astro Blog" - 234 views
3. "Using AI Agents" - 189 views

### Insights
✅ MCP-related content receiving high interest - SEO effectiveness confirmed
✅ Average session time increased - Content quality improvement showing
⚠️ Mobile traffic increasing (42%) - Need mobile UX improvements

### Action Items
1. Create additional MCP series content (high demand confirmed)
2. Optimize layout for mobile users
3. Add related post links to popular posts (increase session duration)
KPI Monitoring Automation
I’ll share actual automation scripts used in production environments.
1. Daily Snapshot Script
A script that summarizes the previous day’s data every morning:
// scripts/daily-snapshot.js
const { GoogleAnalyticsMCP } = require("@analytics-mcp/client");

async function dailySnapshot() {
  const analytics = new GoogleAnalyticsMCP();
  const propertyId = 395101361; // Replace with your property ID

  try {
    // 1. Real-time overview
    const realtime = await analytics.runRealtimeReport({
      property_id: propertyId,
      dimensions: ["unifiedScreenName"],
      metrics: ["activeUsers"],
    });

    // 2. Today vs Yesterday comparison
    const comparison = await analytics.runReport({
      property_id: propertyId,
      date_ranges: [
        { start_date: "today", end_date: "today", name: "Today" },
        { start_date: "yesterday", end_date: "yesterday", name: "Yesterday" },
      ],
      dimensions: [],
      metrics: ["activeUsers", "sessions", "screenPageViews"],
    });

    // 3. Today's Top 5 pages
    const topPages = await analytics.runReport({
      property_id: propertyId,
      date_ranges: [{ start_date: "today", end_date: "today" }],
      dimensions: ["pagePath", "pageTitle"],
      metrics: ["screenPageViews", "activeUsers"],
      order_bys: [{ metric: { metric_name: "screenPageViews" }, desc: true }],
      limit: 5,
    });

    // Output results (can send to Slack, email, or console)
    console.log(`
📊 Daily Snapshot - ${new Date().toLocaleDateString()}

🔴 LIVE: ${realtime.rows ? realtime.rows.length : 0} users online

Today vs Yesterday:
  Users:     ${comparison.rows[0]?.metric_values[0] || 0} (Yesterday: ${
      comparison.rows[1]?.metric_values[0] || 0
    })
  Sessions:  ${comparison.rows[0]?.metric_values[1] || 0} (Yesterday: ${
      comparison.rows[1]?.metric_values[1] || 0
    })
  Pageviews: ${comparison.rows[0]?.metric_values[2] || 0} (Yesterday: ${
      comparison.rows[1]?.metric_values[2] || 0
    })

🏆 Today's Top 5:
${formatTopPages(topPages)}
    `);
  } catch (error) {
    console.error("Daily snapshot failed:", error);
  }
}

function formatTopPages(data) {
  if (!data.rows || data.rows.length === 0) return "No data yet";
  return data.rows
    .map(
      (row, i) =>
        `${i + 1}. ${row.dimension_values[1]} - ${row.metric_values[0]} views`
    )
    .join("\n");
}

// Execute
if (require.main === module) {
  dailySnapshot();
}

module.exports = { dailySnapshot };
How to run:
# Manual execution
node scripts/daily-snapshot.js

# Auto-run daily at 9am via Cron
# Add to crontab -e:
0 9 * * * cd /path/to/your/blog && node scripts/daily-snapshot.js
Best Practices and Tips
1. Data Privacy
- Never commit service account keys to Git
- Use environment variables or secret managers
- Principle of least privilege: Grant only read access in GA
# Add to .gitignore
credentials/
*.json
.env
2. API Quota Management
Google Analytics Data API has daily quotas:
- Default: 25,000 requests per day
- 10 requests per second per project
Optimization tips:
// Use caching
const cache = new Map();

async function fetchWithCache(query, ttl = 3600) {
  const key = JSON.stringify(query);

  if (cache.has(key)) {
    const { data, timestamp } = cache.get(key);
    if (Date.now() - timestamp < ttl * 1000) {
      return data;
    }
  }

  const data = await fetchAnalytics(query);
  cache.set(key, { data, timestamp: Date.now() });
  return data;
}
3. Effective Prompt Writing
Give clear instructions to AI agents:
Bad example:
"Analyze the blog"Good example:
"Analyze the past 30 days of data:
1. List Top 5 pages with view counts
2. Calculate major traffic source ratios
3. Calculate month-over-month growth rate
4. Suggest 3 areas for improvement

Format results as a Markdown table."
Troubleshooting
Authentication Errors
Issue: “Permission denied” or “Invalid credentials”
Solutions:
- Verify service account key path
- Check service account permissions in GA property
- Verify API is enabled:
gcloud services list --enabled | grep analytics
Data Discrepancies
Issue: MCP results differ from GA UI
Causes:
- Timezone differences (GA UI uses property timezone, API defaults to UTC)
- Sampling (occurs with large datasets)
- Filter differences
Solution:
// Specify timezone
{
  date_ranges: [{
    start_date: '2025-10-01',
    end_date: '2025-10-31'
  }],
  // Use property timezone
  keep_empty_rows: true
}
Performance Issues
Issue: Queries are too slow
Optimizations:
- Request only necessary dimensions/metrics
- Limit date ranges
- Use pagination:
{
  limit: 100,
  offset: 0  // Next page: 100, 200, ...
}
Conclusion: Starting Data-Driven Blog Management
Combining Google Analytics MCP with AI agents completely transforms blog management:
Expected Benefits
- Time Savings: Invest time saved from manual analysis into content creation
- Better Insights: AI discovers patterns humans easily miss
- Data-Driven Decisions: Build content strategy with data, not gut feeling
- Automated Workflows: Set it up once and it runs continuously
Scalability
This system can expand beyond blog analytics:
- A/B Test Automation: Automatically measure title, image effectiveness
- Competitor Analysis: Compare with similar blogs
- Predictive Analytics: Forecast future traffic with historical data
- Personalization: Content recommendations based on reader behavior patterns
Next Steps
- MCP Setup: Follow this guide to integrate Google Analytics MCP
- Generate First Report: Start with “Analyze last week’s traffic”
- Customize Agent: Develop analysis logic for your blog
- Build Automation: Set up periodic reports with GitHub Actions
Additional Resources
- Google Analytics Data API Documentation
- Model Context Protocol Spec
- Claude Code Official Docs
- @upenn-libraries/google-analytics-mcp GitHub
Data isn’t just numbers. When properly analyzed and utilized, it becomes a compass for blog growth. MCP and AI agents will automate and accelerate that process.
Now it’s your turn. Start data-driven blog management today!
Questions? Feedback? If you have questions about this guide or real implementation experience, please share in the comments. Let’s build better blog automation systems together.
Was this helpful?
Your support helps me create better content. Buy me a coffee! ☕
Related Articles
-
Specification-Driven Development in the AI Era: Writing Code with Markdown
Covers similar topics in automation, AI/ML, architecture with comparable difficulty.
-
Building an Intelligent Content Recommendation System with Claude LLM
Covers similar topics in automation, AI/ML, architecture with comparable difficulty.

-
Building AI Agent Systems: A Practical Guide to Automation Pipelines with Notion API MCP and Claude Code
Useful as prerequisite knowledge, covering automation, AI/ML, architecture fundamentals.